5.6 EMP_identify_assay
Traditional project data often have a large number of sparse features (e.g., microbial OTU/ASV annotation tables with a large number of very low abundance species), which may be caused by sample contamination, library errors, sequencing bias, or annotation failures. To simplify the calculation and reduce the interference of these sparse features, this module provides two methods to filter the raw data.
5.6.1 Core microbial data
In the microbial species annotation results, it can be found that there are quite a lot of "rare species"(relatively low abundance or low frequency in the sample), which causes strong interference in identifying species with differences between groups, especially when screening key species. Machine learning algorithms (e.g. random forest, LEFse) can easily identify these "rare species" as "different species" between groups. Therefore, it is necessary to filter these "rare species" according to uniform criteria before formal analysis. The module EMP_identify_assay introduces two important parameters to help filter: minnum (minimum relative abundance) and min_ratio (minimum ratio).
First, in the microbial data, any abundance below the specified "minimum relative abundance" is treated as zero. (Note: this does not actually set the original value to zero in the raw data.)
Then, a taxon is considered a "core species" if, in any group of samples, the proportion of samples where its abundance exceeds the "minimum relative abundance" is greater than the "minimum prevalence threshold". All other taxa are classified as "rare species" and are filtered out.
🏷️Example:
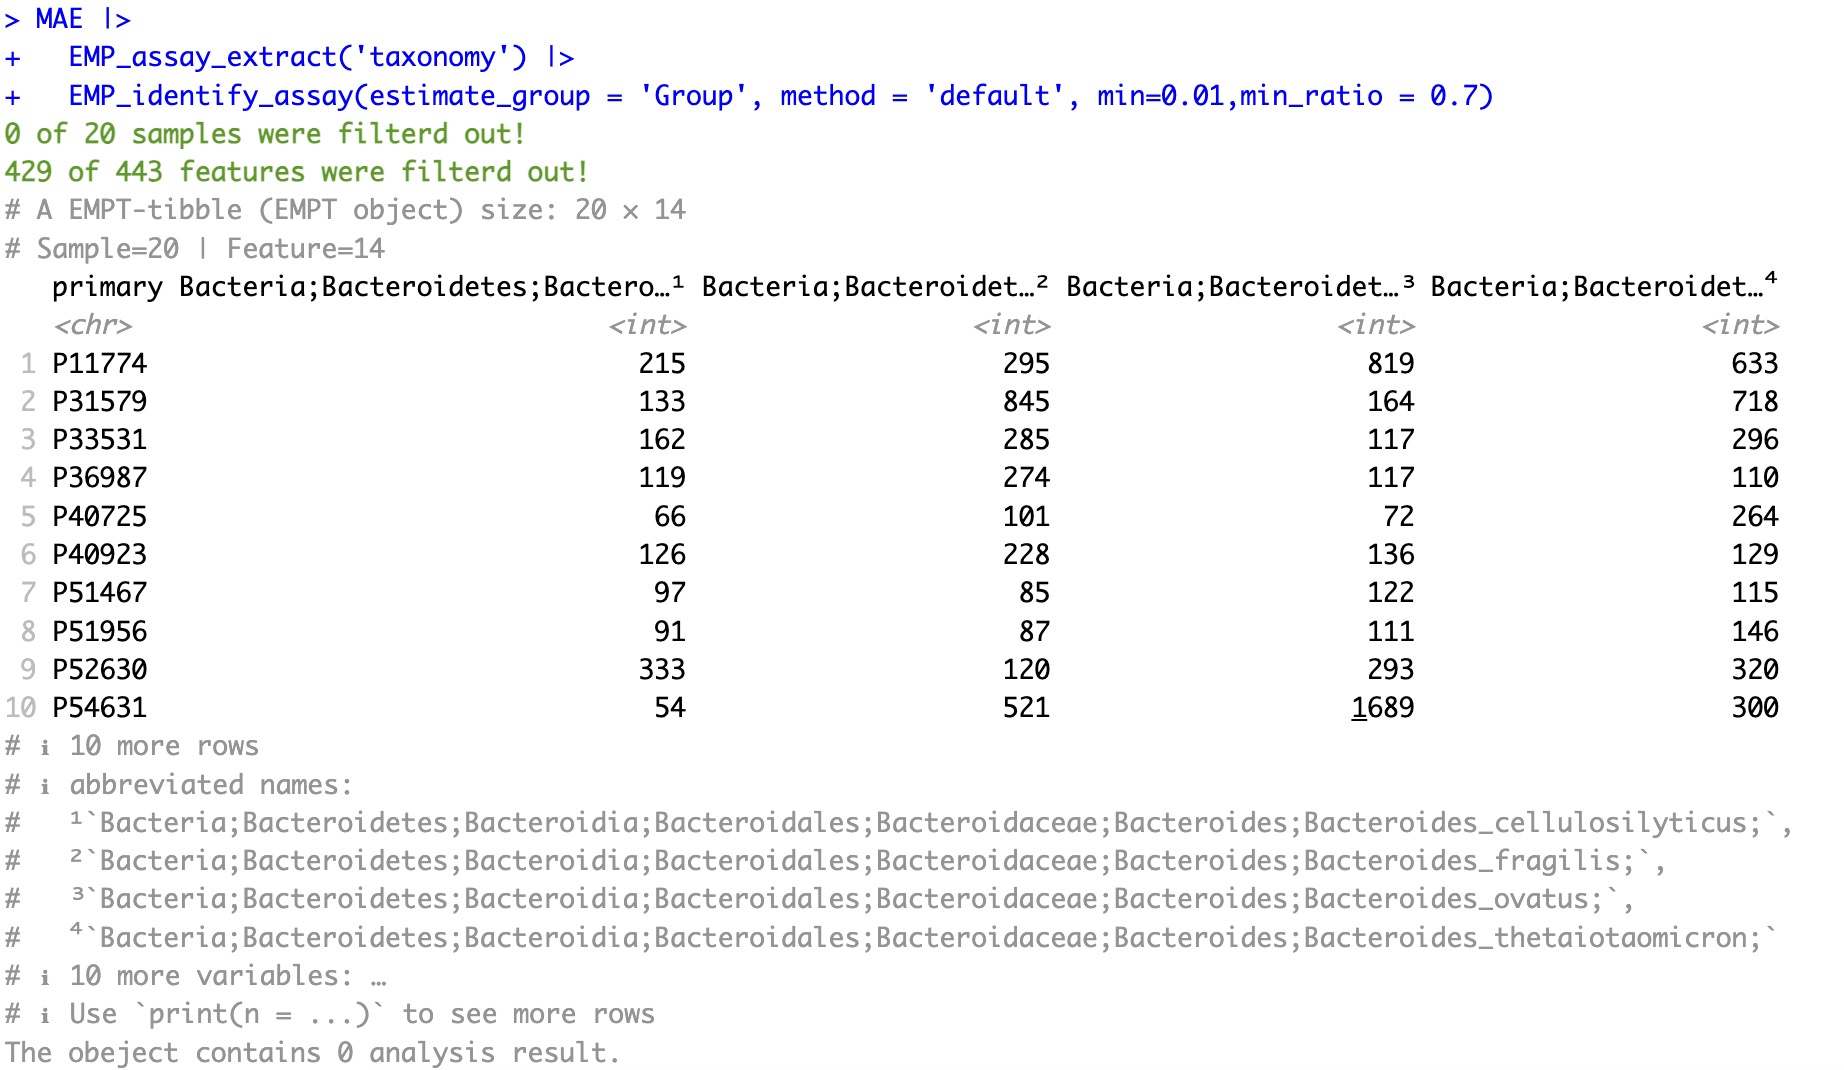
Use the moduleEMP_assay_extract to extract the assay of taxonomy. Use the module EMP_identify_assay filter to obtain core species, the parameter estimate_group specifies Group as grouping information, the parametermin specifies minimum relative abundance as 0.01, and the parametermin_ratio specifies the minimum ratio as 0.7.
①When the input microbial species annotation data is absolute abundance, the module
EMP_identify_assay will automatically convert it to relative abundance during computation. This conversion facilitates filtering and identification of core species during the process, and subsequently outputs the corresponding absolute abundance data based on the filter condition.②These thresholds are user-definable and should be optimized according to the specific experimental design, as no universal values exist. For intestinal microbiome analyses, a minimum relative abundance of 0.001 combined with a minimum prevalence of 0.7 is commonly recommended.
MAE |>
  EMP_assay_extract('taxonomy') |>
  EMP_identify_assay(estimate_group = 'Group', method = 'default', min=0.001,min_ratio = 0.7)
5.6.2 Core genomic data
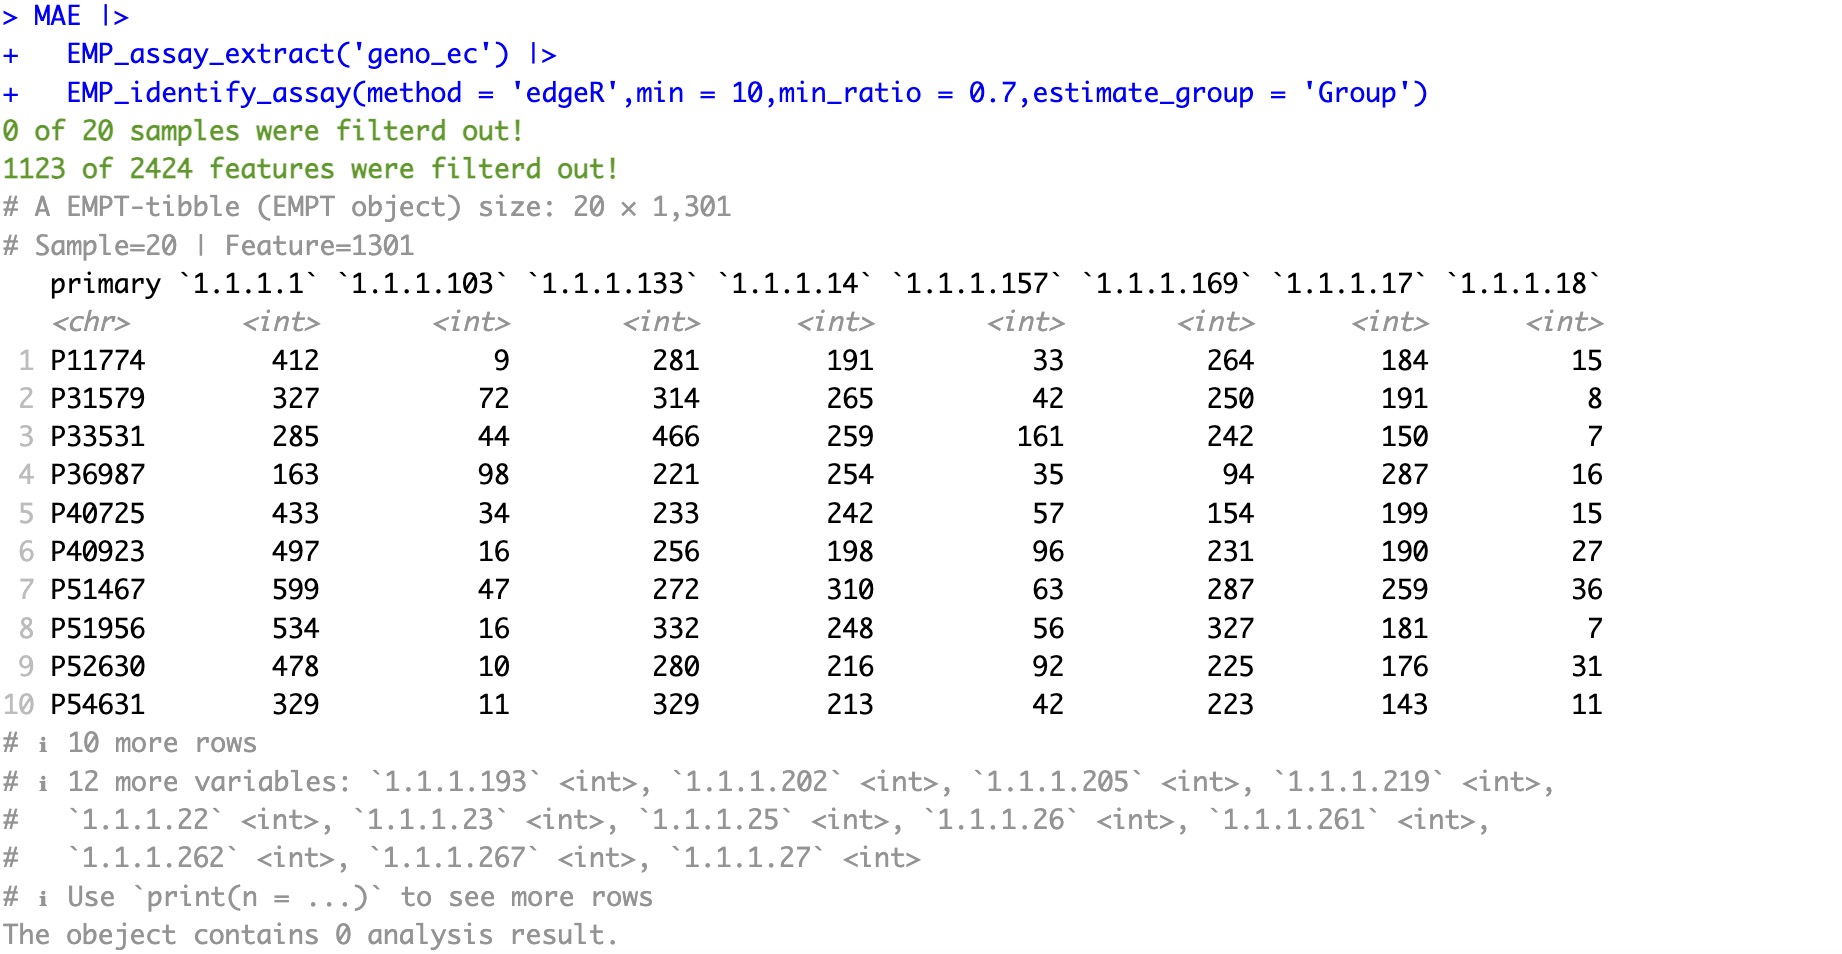
In genomic data, the edgeR package provides a filtering method based on minimum relative abundance, which can be easily invoked by the module EMP_identify_assay to filter genomic/transcriptome data.
🏷️Example:
MAE |>
  EMP_assay_extract('geno_ec') |>
  EMP_identify_assay(method = 'edgeR',min = 10,min_ratio = 0.7,estimate_group = 'Group')